Focus On: Deleaker - a Delphi, C++ & C# Memory Leak Detector
A week or so ago Artem Razin got in touch with me to ask if I'd take a look at his Deleaker program and mention it in my blog. I agreed and this blog is about how I've been using it and what I've discovered.
This is by no means a definitive account of how to use the program and I'm far from an expert user. For the final word on this program, see the Deleaker docs.
You can get a free trial and pricing info from the Deleaker Website.

Disclosure
This is the first blog I've written about a commercial third party program.
For the sake of transparency I want to disclose that I received a free license for this product from Artem, for which I'm grateful.
Offer to other developers
I'm happy to offer to blog about other useful development software (or Delphi libraries) from other small developers. For more info see my "Promoting Delphi developers & applications?" blog post.
So what is it?
Deleaker is memory leak detector / profiler for Delphi, C++ & C# that works with both un-managed and .NET managed code. The program can be installed stand-alone (as in the above screen-shot) and/or it can be integrated into the Delphi / C++ Builder RAD Studio IDE (along with Visual Studio & Qt Creator).
So far I've only used the integrated version of Deleaker with Delphi 11 Alexandria, so I won't be talking about the stand-alone version here. Neither will I be talking about integration with other IDEs, C++, .NET etc. It's a Delphi blog after all - the clue's in the name!
My experience to date of using a memory leak analyser was time spent staring at the built in memory manager's leak warning dialogue box, wondering where to track down the listed leaks. So I didn't know what to expect from this program.

Now don't get me wrong - I have used the info in this dialogue box to track down some hard to find leaks, so I'm not knocking it. But more info would be helpful, and that's what Deleaker gives me, in spades!
Installing
There's a standard Windows installer, which is pretty much as you'd expect. The installer detects what supported IDEs you've got and offers to integrate with them. I've installed it stand-alone and integrated it with all my Delphis:

Integration
If you chose to integrate Deleaker with Delphi / C++ Builder, you'll see a new Deleaker menu option in your IDE's menu bar:

The Deleaker Window is pretty useful if, like me, you just have the one full HD monitor: I have to keep hiding and re-displaying the window as needed. Those with multiple monitors may be able to park it somewhere convenient.
When enabled, Deleaker collects data (takes a "Snapshot") every time you close a program that you have run from the debugger.

So most of the time I have it disabled and re-enable periodically to see if I've introduced a memory leak. Therefore the Enabled option gets a lot of use.
So far I've not had to tinker with the Options dialogue box: there's a lot of control available, most of which is above my head, so I'm leaving well alone until I feel the need to go and tweak something!
Oh, one more thing I found out by accident: Deleaker's window is dockable. If you have enough screen real estate you might want to create a debug desktop with Deleaker docked somewhere:

Basic Use
At first I made the mistake of assuming Deleaker was merely a much enhanced replacement for the old memory manager's Unexpected Memory Leak dialogue box, and indeed I do use it that way. As I mentioned, enabling Deleaker and then running a program from in the IDE's debugger means that Deleaker will run automatically when you close your program. It will check for memory leaks and report them if it finds them, giving huge amounts of data to help you track them down.
Note that you need certain debug information enabled for Deleaker to work. That is well explained in the documentation, so I won't go into it here.
I tried out an example based on one in Deleaker's documentation: I created a small program that deliberately introduced three memory leaks:
- A Delphi Object: a TStringList.
- A GDI object
- Memory allocated with GetMem.

You can see that it lists the type of each leak. Clicking on the leak in the top list view shows the related call stack below. Double-clicking on any unit name takes you to the relevant line in the source code.
But why are four leaks reported, when I created three? Well, it seems the TStringList object is reported both as a Heap memory allocation and as a Delphi object allocation. The other Heap memory allocation is from GetMem and the brush is, well, the HBRUSH allocation.
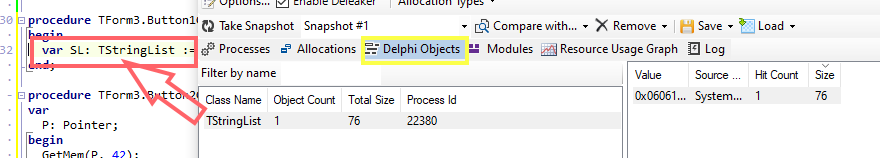
Actually, the easiest way to view Delphi objects is to use the the Delphi Objects tab instead: there's just one entry there. Selecting it shows the associated source units and double clicking on the unit name takes you to the correct line in the code editor:

Hidden leaks? What's that about?

You can also use the Options dialogue box to exclude certain modules:

But, the default is a good choice, because it restricts the reported to leaks to those you can actually do something about. I'm sticking with that.
Going Further
Now, even just reviewing memory leaks when the program you are debugging finishes is a great step up for me, but you can also profile your application's memory use by taking snapshots while it is running.
In this example I created an application that creates three TBitmaps then frees just two of them, resulting in a memory leak. I set a breakpoint on each line of code then ran the application and opened the Deleaker window within the Delphi IDE. Then I took a snapshot, ran to the next breakpoint and took another snapshot. I did this until the program window appeared and then closed the program and kept the snapshot Deleaker took at the end of the program. Each snapshot was given a unique name that described the state of the program when I took it. (You can rename snapshots simply by typing in the combo box and then clicking out of it.)
Here's an animated GIF showing the state of the breakpoints and Delphi objects at each snapshot:

You may notice that only TBitmap & TBitmapImage instances are shown. That's because I have entered TBitmap in the Filter by name edit box to restrict the results shown. If I'd not done this then all the objects that are instantiated by a Delphi 11 VCL application would have been shown. For example, here's the Start-up snapshot again without any filtering:

You can return to any snapshot by selecting it in the combo box. They can also be saved and loaded, although I haven't tried doing that yet. Usefully, you can compare snapshots too. Use the Compare with... button to generate a diff of two snapshots. Here's our our test project showing a comparison of the Create B1 and Create B3 snapshots:

As you can see I've cleared the Filter by name edit control so this comparison is showing all objects created but not freed between the two snapshots. Note that if all objects created between snapshots have also been freed nothing will be shown here.
This is going to be very useful in narrowing down the parts of code where memory leaks get generated.
What are all those tabs for?
There are several tabs of information available, a couple of which I've mentioned. Here's a quick summary of what I've learned so far.
Processes
This is a tab I've not had cause to use. It seems to display the full path to the process being debugged at the time of the snapshot:

Allocations
We've worked with the Allocations tab already. This is the most detailed view. Here's a typical view of the tab, with all leaks displayed. The type of each leak is listed. The call stack for the selected leak is also displayed.

The display can be filtered by leak type by using the Leak type drop down list:

Here's a screen-shot of the same allocations list filtered on GDI objects:

And here's the list again, this time with only Memory leak types displayed:

Delphi Objects
We've already talked about this tab. It lists all the Delphi Objects in the current snapshot. Double clicking a class name opens the code that created the object in the IDE.
For each object its call stack is listed. Don't forget you can limit the number of objects displayed by using the Filter by name edit box.
Modules
Finally, we have the Module tab that displays information about modules loaded by the process:

You can get system load information about each module by right clicking a module and selecting the Symbol Load Information for <module-name> menu option. Here we are displaying system load information for DWMAPI.DLL:

Resource Graph Usage
I've not had cause to use this tab in anger, but it shows graphs of memory usage, the number of allocated handles, number of GDI objects and number of USER objects.
It's going to be useful to find if your application is consuming more and more memory as it proceeds. For example, here's the results of running a test application that create 10,000 TStringList instances every time I clicked a button. You can see memory allocation increasing when I was clicking the button quickly:

This test resulted in a lot of memory leakage. And that slowed down the snapshot that Deleaker took at when I closed the program ... by a lot.
Log
I've not explored this tab at all. I can't find anything in the docs, so no comment!
Summing Up
Personally, I'm going to keep using Deleaker as part of my work flow.
I seem to be settling down into leaving it disabled while I'm hacking away and then running it periodically to make sure I haven't introduced any leaks. If I have and I catch things early enough I can probably track them down easily enough by using the snapshot Deleaker creates when I exit the program. If not I can start setting break points and taking and comparing snapshots until I home in on the leak.
Those main links again:
- Deleaker Documentation
- Deleaker website for the free trial and pricing information.
Any errors and omissions in this blog post are mine. I bear no responsibility for the application itself though.
Thanks once again to Artem for the license.
Comments
Please read this before commenting
Please address any queries about using or buying Deleaker directly to Artem via his website and not in the comments below. All I know I've written above and I've nothing to add!
However, any comments about the post are welcome as always.
What a great review! Dear Peter, thank you so much for taking the time to play with Deleaker and writing such a detailed article.
ReplyDeleteI had heard about DeLeaker and it sounded useful. Thanks for posting a hands-on review of the app. I may have to give this a try myself as your take on it was very positive. Thanks :-)
ReplyDelete